Guide
How tide predictions work
At NOAA's harmonic stations, where predictions come from the gauge's own record, a tide table is a sum of up to 37 cosine waves, each with a period set by the motions of the moon and sun and an amplitude and phase fitted to years of measurements. Five of those waves carry most of the tide, and none of them includes day-to-day weather, which in storms has moved the water more than a meter from the prediction.
I built the tide tool on this site, which shows NOAA's predictions for more than 3,400 US stations. I live near the ocean and I look up the tide situation often. Personally I like to visit tide pools at low tide, and I occasionally go sailing and the tides are very important for coastal sailing. As a solar professional, I knew tides had something to do with the moon/sun, so I figured I would take some time to understand it. Also, finding tides information, at least for my purposes, online is fairly difficult. I built this tool for myself, hopefully others find it helpful. Of NOAA's 3,499 prediction stations, 2,243 are subordinate stations with no constituents of their own; their highs and lows are time and height offsets from a nearby harmonic station. I recomputed NOAA's predictions for three harmonic stations from their published constituents.
NOAA's prediction formula
NOAA's page on harmonic constituents gives the method in one line:
h = H0 + Σ f·H·cos(a·t + (V0 + u) − κ)
Each term is one constituent, a cosine whose speed a (degrees per hour) comes from astronomy: M2, the main lunar constituent, has two peaks every 24 hours and 50 minutes, the time the moon takes to come back overhead. t is time in hours from the moment for which V0, each wave's starting point, is computed from the positions of the moon and sun.
The amplitude H and the phase lag κ are local, because each coastline and basin responds differently to the same forcing. NOAA gives κ relative to Greenwich, with t in UTC (the Phase column with GMT selected on a station's constituent page), so one set of V0 values serves every station. NOAA fits H and κ to the gauge record, using at least 30 days of data and a full year to separate all 37 constituents, and sets some to zero (Boston keeps 34, San Francisco 33, Pensacola 30). H0 is mean sea level above the chart datum, mean lower low water (MLLW).
The node factors f and u adjust each lunar wave for the year. The plane of the moon's orbit turns over an 18.6-year cycle, which changes how far north and south of the equator the moon travels and so how strong each lunar constituent is. In 2026 they make M2 3.3% weaker than its long-term average, and K1 and O1, the two main once-a-day constituents, 10% and 17% stronger.
To check the method, I summed all 37 constituents, with the 2026 node factors, at every 6-minute step of August 2026. The RMS difference (root-mean-square, the typical size of the gap between two curves) from NOAA's published prediction was 0.3–0.4 mm at all three stations, close to the 0.3 mm that NOAA's rounding to the millimeter produces on its own, and the largest single difference was 1.1 mm. Without node factors, the San Francisco sum missed by up to 14.7 cm.
How many constituents a prediction needs
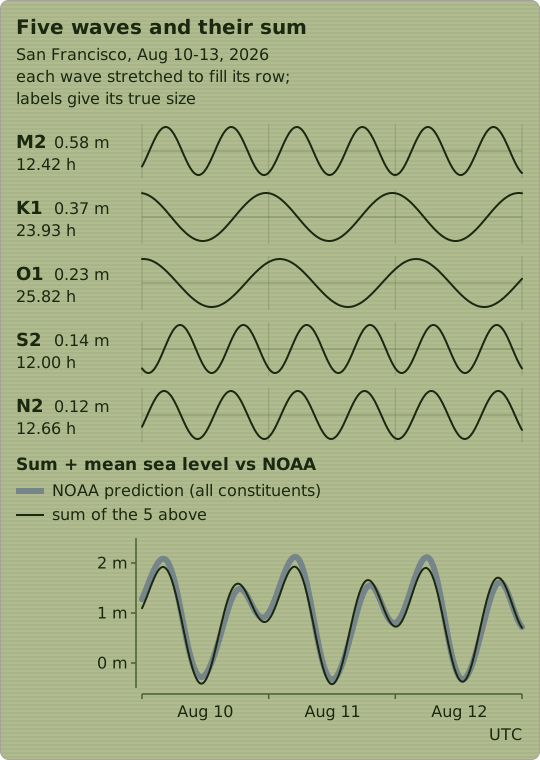
Five constituents are large at San Francisco: M2 and N2 (lunar, twice a day, 12.42 and 12.66 hours), S2 (solar, twice a day, 12.00 hours), and K1 and O1 (once a day, 23.93 and 25.82 hours). The first figure shows each over three days and their sum against NOAA's prediction.
The second figure adds constituents one at a time, largest first, at all three stations.
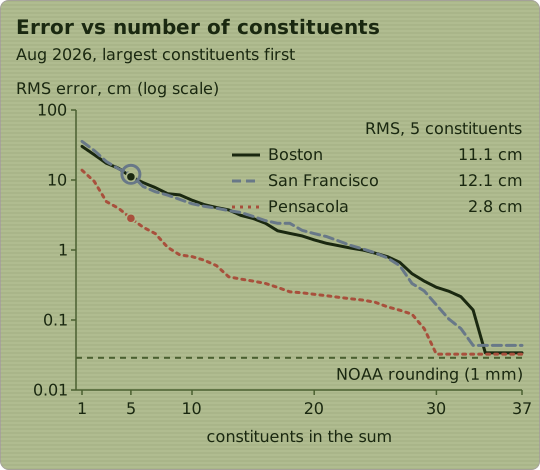
The same five are the largest at Boston. They account for 95.7% of the tide's variation at San Francisco and 98.8% at Boston, with RMS errors of 12.1 cm and 11.1 cm. The sixth at San Francisco is P1 (0.114 m), the solar diurnal constituent, and adding it brings the error down to 8.1 cm. Twenty constituents get both stations under 2 cm RMS.
Pensacola's top five are K1, O1, SA, SSA and P1. SA and SSA have periods of one year and half a year, 11.3 cm and 5.4 cm there. NOAA fits them from 20 years of monthly means, so they carry the average seasonal cycle of sea level, which NOAA attributes to regular changes in coastal temperature, salinity, winds, air pressure and currents.
Spring and neap tides as beats between constituents
Every 14.77 days M2 and S2 line up and add, giving spring tides near new and full moon, and halfway between they partly cancel, giving neap tides near the quarter moons. N2 beats against M2 every 27.55 days, the time the moon takes to go from perigee (its closest point) back to perigee. The envelope of a group of constituents is the curve through the highs and lows that group alone would produce.
At Boston, N2 (0.305 m) is 1.47 times as large as S2 (0.208 m), so the perigee–apogee cycle moves the range more than the spring–neap cycle does, and the month's largest tides come when perigee falls near a new or full moon. The next figure shows August 2026, when perigee on August 10 came two days before the new moon on August 12, and apogee (the moon's farthest point) on August 22 came two days after the first quarter on August 20.
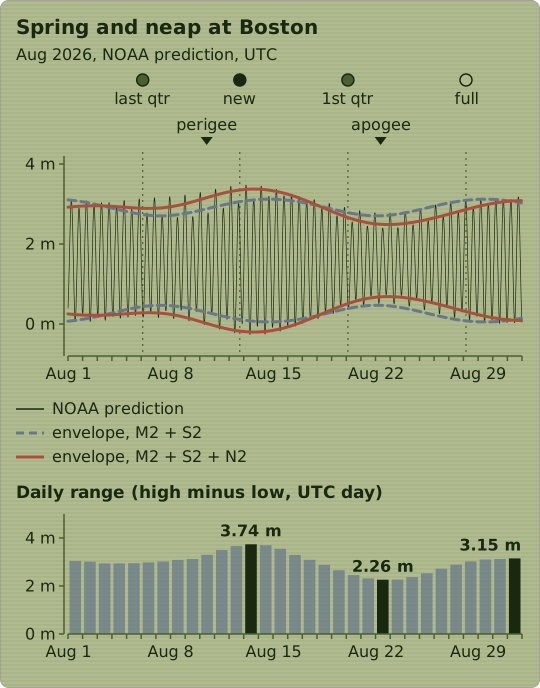
The daily range, the highest minus the lowest predicted level within a UTC day, peaked at 3.74 m on August 13, a day after the new moon, and bottomed at 2.26 m on August 22.
The form number: one tide a day or two
The balance between K1 + O1 and the twice-a-day constituents sets the daily pattern. The usual measure is the form number F = (K1 + O1) / (M2 + S2), with tides called semidiurnal below 0.25, mixed from 0.25 to 3 and diurnal above 3 (Scientific Reports, 2023). From NOAA's amplitudes, Boston's F is 0.16, San Francisco's 0.84 and Pensacola's 11.2, one of each of NOAA's tide types. To classify another station, open its Harmonic Constituents page on Tides & Currents (San Francisco's, for example) and divide K1 + O1 by M2 + S2; for a subordinate station, use its reference station. The next figure shows two weeks at the three stations.
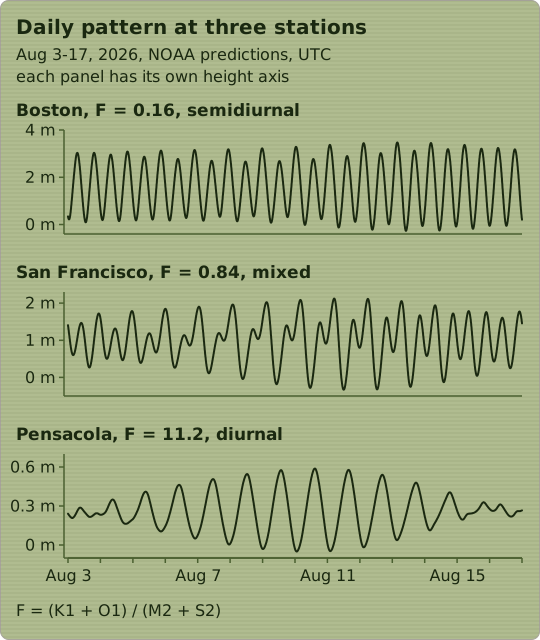
K1 and O1 beat every 13.66 days as the moon swings north and south of the equator; the once-a-day tide is strongest when the moon is farthest from the equator and nearly vanishes as it crosses. Pensacola's daily range went from 0.08 m on August 3 to 0.64 m on August 10 and back to 0.09 m on August 16. On the small days its 1.7 cm M2 shows through: NOAA's August 2026 table for Pensacola lists one high and one low on 29 days, and two of each on August 3 and 30.
NOAA calls the unequal pairs higher high and lower low water. At San Francisco, successive lows in these two weeks differed by up to 1.28 m. Because MLLW is the average of the lower lows, many of them fall below zero at every station; San Francisco's prediction reached −0.33 m in August 2026.
Weather and the residual
NOAA's FAQ says it predicts the astronomical tide and "cannot predict the effect that wind, rain, freshwater runoff, and other short-term meteorological events will have on the tides." NOAA also notes that onshore winds tend to raise water levels and offshore winds tend to lower them. Observed minus predicted level is the residual, drawn in red below for two storms.
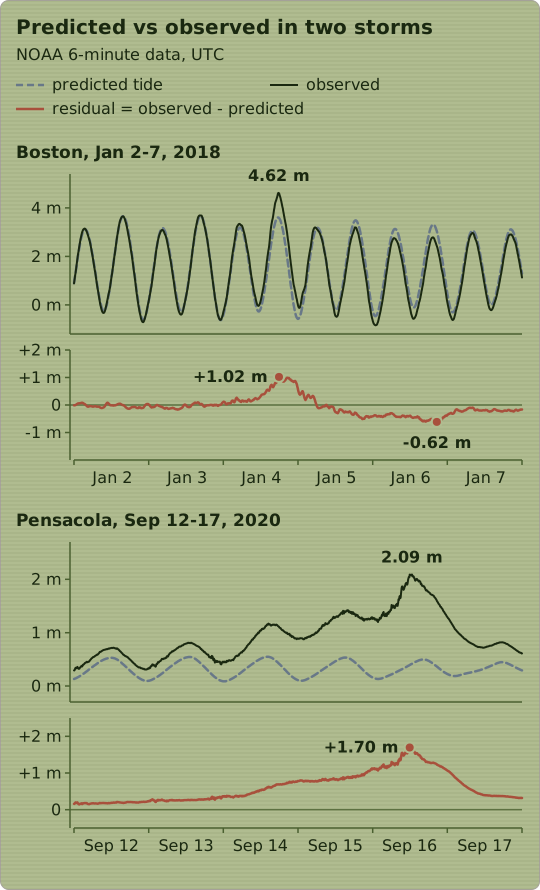
At Boston on January 4, 2018, the water reached 4.62 m (15.16 ft) above MLLW at 17:42 UTC, against a predicted high of 3.61 m, then the highest in the gauge's record, which goes back to 1921. After the storm the residual stayed negative for days. The low water at 00:54 UTC on January 6 came in at −0.84 m against a predicted −0.46 m, 38 cm short, and at 20:36 UTC that day, near high water, the residual reached −0.62 m.
At Pensacola the residual built over four days as Hurricane Sally approached, to +1.70 m at 11:54 UTC on September 16, 2020, the day Sally made landfall near Gulf Shores, Alabama. The water peaked at 2.09 m above MLLW against a predicted 0.42 m, while the predicted range for the whole week was 0.46 m.
Hourly verified water levels against the prediction for all of 2025:
| Station | Mean residual | 2.5th–97.5th percentile | Lowest | Highest |
|---|---|---|---|---|
| Boston | +12.6 cm | −12.7 to +38.3 cm | −66.4 cm | +74.1 cm |
| San Francisco | +6.2 cm | −5.8 to +21.5 cm | −14.0 cm | +53.6 cm |
| Pensacola | +13.4 cm | −9.7 to +33.2 cm | −36.8 cm | +55.1 cm |
Most of the mean offset is sea-level rise. NOAA's predictions are centered on mean sea level for 1983–2001, and at each gauge's long-term trend of 2.0 to 3.0 mm per year the sea has risen about 7 to 10 cm since the middle of that period.
Margins for depth and bridge clearance
Heights in a US tide table are above MLLW, the same datum as the soundings on a NOAA chart, so available depth is the charted depth plus the predicted height plus the residual.
In 2025 the water at these gauges was no more than 13 cm (5 in) below the prediction on 97.5% of hours, and Boston's worst hour was 66 cm (2.2 ft) low, so depth margins should grow after strong offshore wind or a storm.
Bridge clearances on US charts are measured from mean high water (MHW) unless the chart states otherwise, per the Coast Pilot, so the clearance under a span is the charted figure minus the amount the predicted height exceeds MHW, minus a residual margin; 22 to 38 cm (9 to 15 in) covered the residual on 97.5% of 2025 hours at these gauges. Each station's Datums page gives MHW above MLLW (Boston 3.00 m, San Francisco 1.59 m, Pensacola 0.37 m).
The tide tool shows predictions only; NOAA's page for the same station plots observed water level against the prediction.