Guide
Why solar noon is rarely at 12:00, and which clock your solar data uses
In 2026, solar noon in Boston, Detroit and Amarillo falls anywhere from 11:28 a.m. to 1:58 p.m. on the wall clock, and in July it comes after 1 p.m. across most of the Eastern time zone. Solar weather data, household electricity data and time-of-use rates, which charge more per kWh during set on-peak hours, each follow their own clock, so combined without conversion they can sit one or more hours apart.
What moves solar noon away from 12:00
Solar noon is the moment the sun crosses your meridian, the north–south line through your location, and is highest for the day. Clocks keep mean solar time, set by an imaginary sun that crosses the sky at a perfectly steady pace. Each US time zone uses the mean solar time of one reference meridian: 75°W for Eastern, 90°W for Central, 105°W for Mountain and 120°W for Pacific.
Three things move solar noon off 12:00:
- Your longitude inside the zone. The sun covers 1° of longitude every 4 minutes, so 8° west of the zone meridian means solar noon 32 minutes later.
- The equation of time, which moves solar noon earlier or later by up to about 16 minutes depending on the date.
- Daylight saving time, which sets clocks an hour ahead from 2 a.m. on the second Sunday in March to 2 a.m. on the first Sunday in November (15 U.S.C. 260a). In 2026 that is March 8 to November 1. Hawaii and most of Arizona stay on standard time all year.
On the clock, solar noon = 12:00 + 4 minutes × (degrees west of the zone meridian, negative if you are east of it) − equation of time, plus one hour during daylight saving time. I computed the times below with the Python version of the Solar Position Algorithm from the National Laboratory of the Rockies (formerly NREL) that runs my Solar Position tool.
The equation of time
Because Earth's orbit is slightly elliptical and its axis is tilted 23.4°, the real sun runs ahead of or behind the steady imaginary one that clocks follow; the equation of time is that gap in minutes.
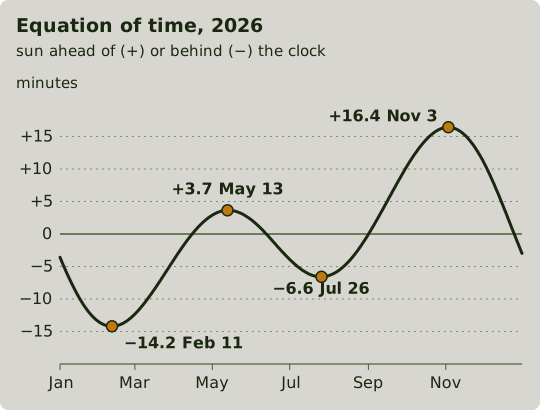
In 2026 the equation of time puts solar noon 14.2 minutes after mean noon (12:00 mean solar time at your longitude) on February 11 and 16.4 minutes before it on November 3 (November 2 matches to within a second). These offsets are the same at every longitude, and NOAA's solar calculator prints them for any day. The longitude term then sets the clock time: Boston's longitude puts its solar noon 15.8 minutes before 12:00 standard time, so on February 11 it comes at 11:58 a.m.
Where you sit in your time zone
Zone boundaries follow state and county lines, so in the US, Eastern time runs from Eastport, Maine, at 67°W to nearly 90°W in Michigan's Upper Peninsula (89.9°W at the Ontonagon–Gogebic county line).
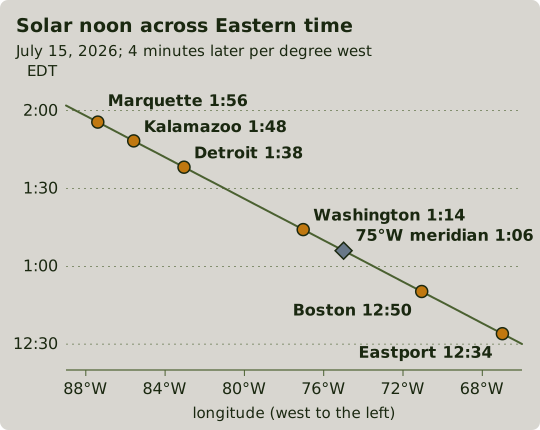
On July 15, 2026, solar noon comes at 12:34 p.m. Eastern Daylight Time (EDT) in Eastport and at 1:56 p.m. in Marquette, Michigan, 82 minutes later. The zone's full width spans about 92 minutes. At the 75°W meridian it is 1:06 p.m.: 12:00, plus 6 minutes from the equation of time, plus the daylight saving hour.
Three cities through the year
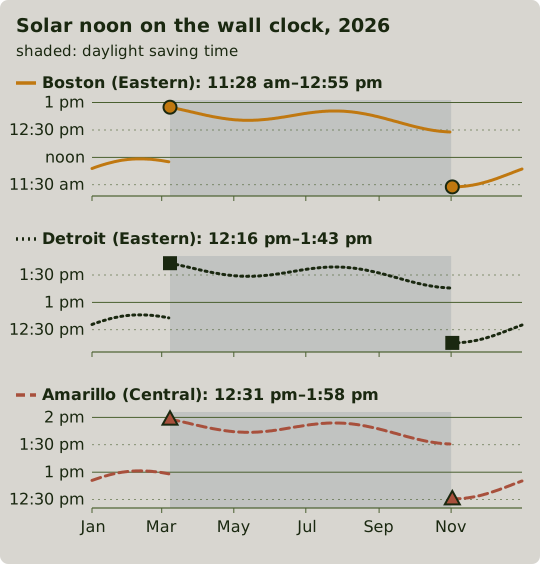
The next chart follows Boston, near the east edge of Eastern time, Detroit, west of the zone meridian, and Amarillo, a Central-zone city far west of its meridian. Each spans 87 minutes on the clock over the year.
Which clock each data source uses
A clear day's sunlight is centered on solar noon, which makes the arithmetic above a test of any dataset's clock; the last section shows how. The National Solar Radiation Database (NSRDB) publishes hourly sunlight for US locations, and its typical meteorological year (TMY) files combine real months from different years. The API returns timestamps in Coordinated Universal Time (UTC) by default, and asking for local time gives "local time of data point (without daylight savings time)" (API documentation). My residential tool, which models a home's hourly solar production and electricity use from its address, requests UTC and shifts every hourly array, so its charts run on local standard time all year.
ResStock, the National Laboratory of the Rockies' model of the US housing stock, publishes end-use load profiles: simulated 15-minute electricity use for representative homes. In those files "the timestamps of all load profiles have been converted to Eastern Standard Time" (EST) for every state, and each stamp marks the end of its 15-minute interval. The simulations themselves ran on local standard time, with occupant schedules shifted for daylight saving (ResStock FAQ). Bringing them into the tool meant moving each state's file from EST to UTC and then to the location's standard time.
Of the three residential time-of-use tariffs, or published rate schedules, that I checked, one names prevailing time, meaning the wall clock with daylight saving: Duke Energy Progress's North Carolina schedule states that "All hours are shown in Eastern Prevailing Time (EPT)" (schedule). One fixes its window in standard time: Potomac Edison in Maryland lists its on-peak period as 4–9 p.m. EDT and 3–8 p.m. EST (rates), so the window reads an hour later on the clock during daylight saving. The third names no clock: Consumers Energy's standard residential rate in Michigan charges on-peak prices from 2:00 to 7:00 p.m. on weekdays from June 1 to September 30 (Rate RSP; summary), and I found no time basis in its rate book.
SAM, the laboratory's free System Advisor Model software for modeling PV output and bill savings, applies time-of-use schedules in local standard time with no daylight saving adjustment, and its support staff suggest shifting the schedule by hand (SAM forum).
What the wrong clock does to a chart
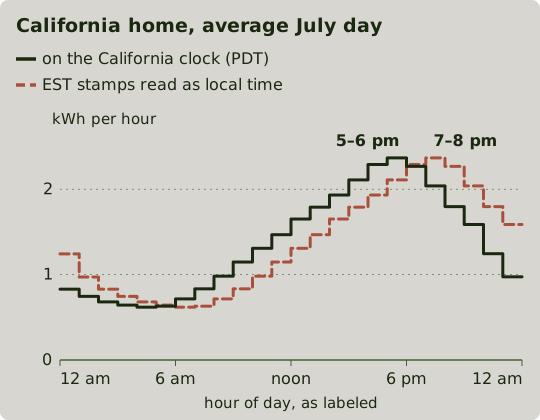
The chart below is the July average day for the home the tool builds by default for California from ResStock's statewide single-family results (gas heat, central air, 8,750 kWh a year). With the EST stamps read as local time, the evening peak falls in the hour starting 7 p.m. On the California clock, Pacific Daylight Time (PDT), it is the hour starting 5 p.m. The tool, which charts on standard time, labels it the hour starting 4 p.m. Pacific Standard Time (PST).
For a rate window, I took a clear July 15 from the NSRDB typical year near Kalamazoo (42.21°N, 85.58°W), which is in Consumers Energy's territory.
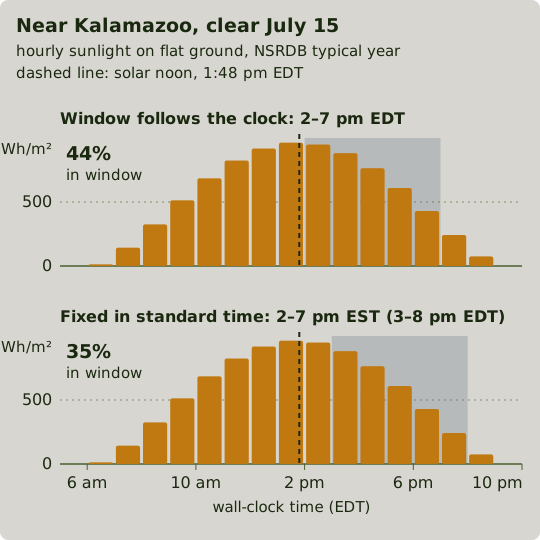
The window holds 44% of that day's sunlight on the clock and 35% if fixed in standard time. The 35% case is also what SAM produces for a clock-time window unless the user shifts the schedule by hand. Over the 88 June–September weekdays (from the 2026 calendar, since a typical year has no real weekdays), the two readings give 43% and 34%.
These are shares of sunlight on flat ground, the shape the tool gives hourly production; a real array's orientation and tilt change them, and one facing west of south puts more of its output into the window.
How to tell which clock a dataset uses
Start with the documentation: NSRDB files carry a "Time Zone" field (0 for UTC) and a "Local Time Zone" field with the standard offset. Without documentation, a wall-clock series gives itself away with a 23-hour day on the second Sunday in March and a 25-hour day, or a repeated hour, on the first Sunday in November.
For sunlight or production data, two things move the curve: the clock, and which part of the hour each stamp marks. A value stamped 1:00 can cover 1:00 to 2:00, 12:30 to 1:30 or 12:00 to 1:00, so hour-starting and hour-ending stamps sit a full hour apart, as far apart as the daylight saving error. I measure a clear day by its center: the average of its stamps, each weighted by that hour's sunlight. In summer, hour-ending standard-time data, the convention of the older TMY3 files (TMY3 manual), reads an hour early for its clock and 30 minutes late for its stamps, so its center sits 30 minutes before wall-clock solar noon, exactly like hour-starting wall-clock data.
Two clear days separate them, as the tool's standard-time array for the Kalamazoo location shows. On February 22, when standard time and the wall clock agree, the day centers at 12:28 p.m. against a solar noon of 12:56 p.m. from the Solar Position tool, about 30 minutes early, so each stamp marks the start of its hour. On July 15 it centers at 12:17 p.m. against a wall-clock solar noon of 1:48 p.m.; adding back the 30 minutes leaves it an hour early, so the array is on standard time.
| Clear day | Center vs. wall-clock solar noon | Meaning |
|---|---|---|
| Winter | 30 min early / on it / 30 min late | stamps mark the start / middle / end of the hour |
| Winter | 5 to 8 h late | UTC |
| Summer, after the stamp correction | on it / 1 h early | wall clock / standard time |
| Summer, after the stamp correction | 4 to 7 h late | UTC |
The UTC ranges are for the contiguous states; Alaska runs 8 to 9 hours behind UTC and Hawaii 10. In Arizona and Hawaii, where standard time is the wall clock all year, the winter day alone settles it. All nine NSRDB files I tested, from eight states, center on solar noon only when each stamp is read as the start of its hour.
I do the arithmetic in UTC, which has no missing or repeated hours, and convert to the tariff's clock only at the step that applies rate windows. For standard-time arrays under a prevailing-time tariff, that means shifting them one hour between the March and November changes.