Guide
Why west-facing solar panels fall further behind east-facing ones in north Florida than near Phoenix
In north Florida, a west-facing roof plane at a 30° pitch gets about 5% less sunlight over a year than an east-facing one, and about 11% less from June through August, because summer clouds build after midday. Near Phoenix the two directions come out within about 1% of each other on weather alone.
I checked this with the weather data the Resi solar tool loads for every address and with NREL's PVWatts calculator, using real houses I keep as test cases for the tool: one in Middleburg, Florida, southwest of Jacksonville (the north Florida numbers all come from this one 4 km weather cell), one in Gilbert, Arizona, in the Phoenix metro, and seven more in Chandler (Arizona), Albuquerque, Oakland, New Jersey, Ohio, Illinois and Michigan. The per-module estimates the tool lists come from Google and show a larger east/west gap than the weather does, in Arizona as well as Florida.
North Florida's summer afternoons are cloudier than its mornings
The weather behind the Resi tool is the NSRDB typical meteorological year from NREL (now the National Laboratory of the Rockies): 8,760 hours of satellite-derived sunlight for a 4 km grid cell, stitched together from real months. The tool stores its global horizontal irradiance, the sunlight falling on a flat, level surface. To see when clouds get in the way, I divided each hour's value by a clear-sky estimate for the same sun position (the Haurwitz model, with sun angles from the site's own solar position code) and averaged the result by hour of solar time. Solar time shifts the clock so that noon is when the sun is due south. In summer that is about 1:30 p.m. daylight time in Middleburg and about 12:30 p.m. in Gilbert, since Arizona stays on standard time.
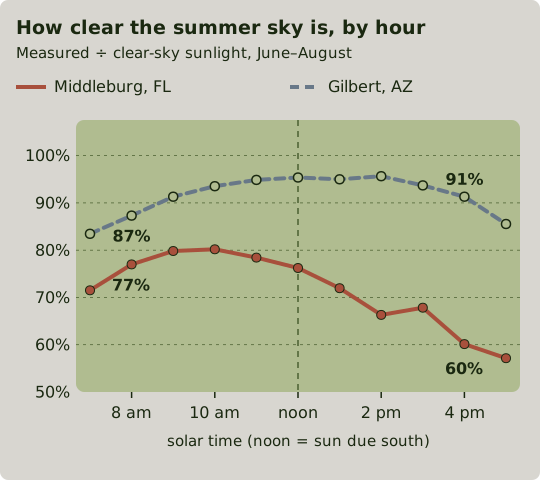
From 8 to 11 a.m. solar time, Middleburg's summer sky passes 79% of clear-sky sunlight on average, and from 1 to 4 p.m. it passes 67%. Gilbert's passes 92% and 94%. The National Weather Service ties Florida's summer thunderstorm season to the daily sea breeze, and the afternoon drop fits clouds and storms building over land as the day heats up. From October through April the difference mostly goes away: Middleburg's sky passes 81% of clear-sky sunlight in the morning and 79% in the afternoon.
What that does to an east plane and a west plane
A west-facing plane gets most of its sunlight after solar noon, so afternoon clouds cost it far more than an east-facing one. I ran PVWatts v8 for both houses with a 30° plane facing due east and one facing due west, and compared the sunlight each plane receives. PVWatts runs on its own, older NSRDB typical year, not the file the tool uses, so it also checks the weather data.
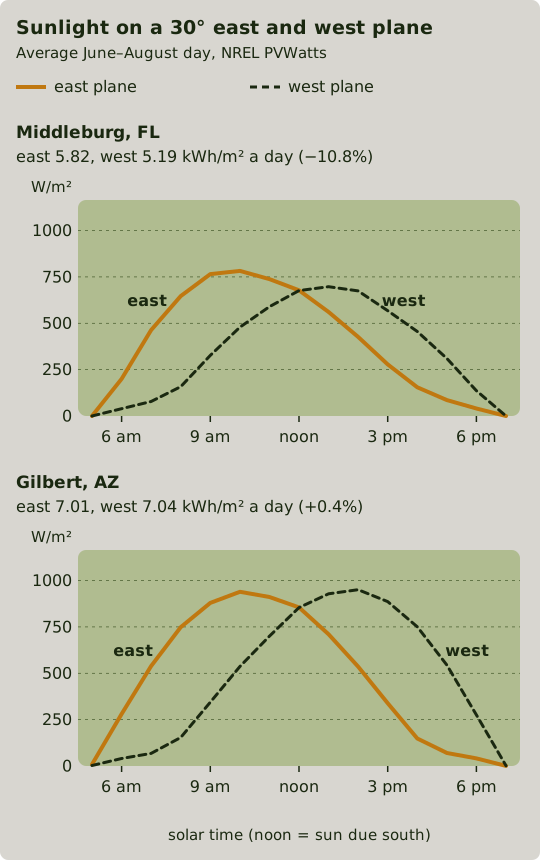
On an average June–August day in Middleburg, the east plane gets 5.82 kWh/m² and the west plane 5.19 kWh/m². The west curve tops out around 700 W/m² against 780 W/m² for the east. In Gilbert the two planes get 7.01 and 7.04 kWh/m². Figure 3 repeats the comparison month by month.
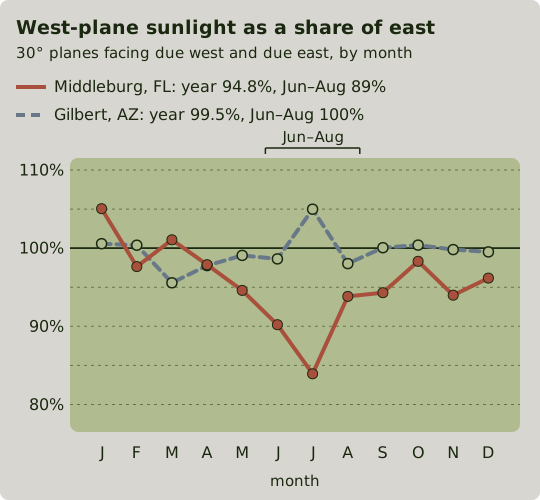
Over the year, PVWatts puts the sunlight on Middleburg's west plane at 94.8% of the east plane's: 89% in June–August, about 94.5% in May and September, and 98.6% from October through April. Gilbert's west plane gets 99.5%. A second check with the tool's own weather file, splitting sunlight into direct and diffuse parts (the Erbs model) and projecting both onto each plane (the Hay-Davies model), gives 95.3% for Middleburg and 100.3% for Gilbert.
The same second check at the other test houses puts Chandler at 100.7% and Ohio, Illinois and Michigan within 1% of even. Albuquerque comes out at 96%; its summer sky passes 93% of clear-sky sunlight at 8 a.m. and 74% at 4 p.m. New Jersey also comes out at 96%, with afternoons a little cloudier than mornings across the year (74% at 8 a.m., 66% at 4 p.m.). Oakland goes the other way at 106%, because its summer mornings are the cloudier part of the day (61% at 7 a.m., 86% at 5 p.m.).
The Middleburg roof in the Resi tool
The Middleburg house has a south plane, two east planes at 31° and 33° pitch, and a west plane at 32°. The tool's roof-planes list gives each plane's direction as a compass bearing (90° is due east, 180° due south, 270° due west), its pitch, and its yearly output per module. Those numbers come from Google's Solar API, which estimates the yearly sunlight on every spot of a roof, including shade from trees and nearby buildings. The tool lists about 643 kWh a year per 400 W module on the better east plane and 548 on the west, so the west plane reads 85% of the east. Google's own panel layout averages 641 and 545, which I use below; the tool reads the same sunlight map at its own module positions. On weather alone the same two planes differ by 4.6% using the tool's weather file or 5.0% using PVWatts.
Against the south plane, whose modules average 698 kWh in Google's layout, the east planes make 92% and 90% in Google's numbers and about 85% on weather alone. The west plane makes 78% in Google's numbers and 82% on weather alone.
Google's numbers against the weather on four roofs
Figure 4 compares the two for the same pair of planes on four roofs.
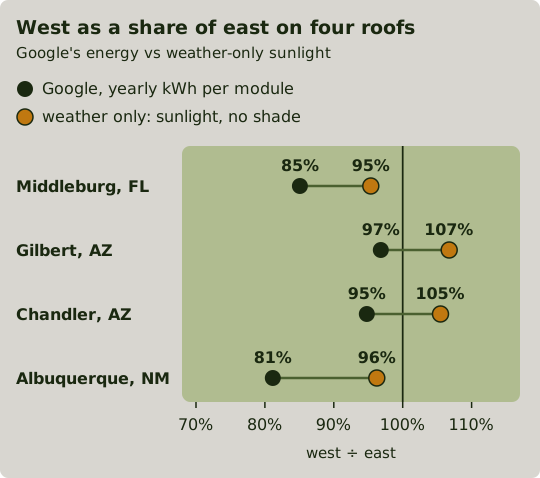
The extra 10 points is not specific to Florida. On the turned Gilbert and Chandler roofs, weather alone puts the west side 7% and 5% ahead; Google's numbers put it 3% and 5% behind. Shade on part of the roof does not explain the offset either: even the best module on Middleburg's west plane (576 kWh) is 10% below the east plane's average (641 kWh), and every module on Gilbert's west plane falls between 702 and 712 kWh. Because the offset is about the same on the Middleburg and Gilbert roofs (10.3 and 9.9 points), the climate difference between the two places carries through into the tool; for due east and west planes it is about 5 points (95.3% against 100.3% on weather alone).
Measured against each roof's south plane, Google rates the east planes 4 to 6 points higher than the weather does and the west planes 3 to 5 points lower. Panel heat on hot afternoons doesn't account for that: in PVWatts, which models panel temperature, the west/east output ratio stays within a point of the sunlight ratio (94.7% against 95.0% in Middleburg, 105.8% against 106.3% in Gilbert), and Google's concepts page doesn't list temperature among its inputs. It looks more like the whole day shifted toward the morning, so southeast-facing planes probably read a little high in the tool and southwest-facing planes a little low. The offset also varies by place: on the least-shaded east/west pairs at the Michigan, Ohio and Illinois houses it is 0.9, 6.5 and 11.3 points. Google's methodology page says the model uses weather data from NREL and Meteonorm, and its concepts page puts the hourly data on a 4 to 10 km grid. Neither says which source covers a given address, and I can't tell from outside which step produces the offset.
How to check your own roof
- Open /resi-solar and enter your address; the tool analyzes the roof straight away. If it picks the wrong building, press "change", drag the pin and click Confirm and Analyze Rooftop. In the roof-planes list, pick an east plane (bearing near 90°) and a west plane (near 270°) with similar pitch, and divide the west plane's kWh per module by the east plane's.
- Compare the result with what the tool shows for a due east/west pair: 85% in Middleburg, where the planes are about 31°, and by my estimate about 90% near Phoenix, where they are about 19° (100% on weather alone, less the 10-point offset seen on both Phoenix-area roofs). If your roof is turned so the west plane faces south of due west, add about 5 points for each 10° of turn (measured on roofs of about 19° pitch; more on steeper roofs); if it faces north of due west, subtract the same. Outside north Florida and the Phoenix area I don't have a benchmark, because the offset ranged from under 1 to 11 points on the Midwest roofs.
- If your west plane reads more than about 5 points below that benchmark, or you are outside those two areas, turn on the Flux layer on the satellite view. It colors every spot on and around the roof by Google's estimate of its yearly sunlight, from dark purple (least) to yellow (most). The list shows only each plane's average, so the Flux layer is where module-to-module differences show up. An evenly colored plane is losing to orientation and weather; a darker patch or a darker edge means shade. On the Albuquerque roof in Figure 4, the west plane reads 81% of the east against 96% on weather alone. In Google's layout its modules run from 398 kWh at the south end, nearest a large tree off the southwest corner of the house, to 632 kWh at the north end, while the east plane's modules range from 594 to 719 kWh.
- Look at the houses next door in the same Flux view. If their west planes are as dark as yours, the cause is the climate or Google's model and not something on your lot.
For how the pieces fit into a production estimate, see How much energy will my solar panels make?