Guide
When homes use electricity: hourly load by heating fuel and climate
In ResStock, the National Renewable Energy Laboratory's simulation of the US housing stock, a Michigan home heated by a heat pump (which moves heat from outdoor air into the house) or by electric resistance (baseboards or an electric furnace) uses four to nearly five times the electricity of a gas-heated home of the same size, while floor area changes use by about 50%. A federal survey of real homes in Michigan and four neighboring states puts that fuel gap nearer two. About half the year's hours have no sun, and midday and summer output often exceeds use at the time, so for homes in four states paired with a modeled flat array sized to their yearly use, solar supplies only 33% to 50% of that use directly.
Where the numbers come from
ResStock is a model of the US housing stock built by NREL (the National Renewable Energy Laboratory, renamed the National Laboratory of the Rockies in December 2025). It creates about 550,000 simulated homes with characteristics sampled from survey data and runs each one through EnergyPlus, the Department of Energy's building energy simulation program. The lab publishes the results through its End-Use Load Profiles project on the Open Energy Data Initiative, by state and end use at 15-minute resolution.
I used the 2024 release 2 baseline, which models the stock as it stands with no upgrades, on TMY3 weather, a typical year built from real months of a multi-year record: 338,028 simulated single-family detached houses in the 48 contiguous states and DC. For each state I worked out how heating, cooling and other use are spread over the 8,760 hours of the year, and the yearly kWh of each for occupied houses by heating type and floor area. A Michigan gas-heated home's 849 kWh of heating electricity, for example, is spread over the year in the same hourly pattern as all Michigan heating, and likewise its cooling and other use. A home's timing therefore changes only when its mix of heating, cooling and other use changes. Cooling kWh are also the same for every heating type of a given size.
NREL stamps every state's data in Eastern Standard Time (README), so I shifted each state to its own standard time. An hour written as 19:00 means the hour from 19:00 to 20:00, local standard time; summer clock time is one hour later everywhere except Arizona.
Heating fuel against floor area
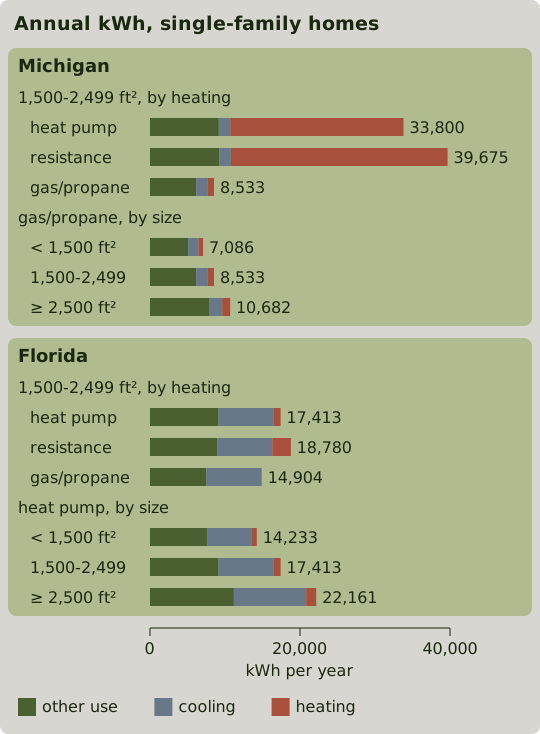
A Michigan home of 1,500 to 2,499 ft² heated with gas or propane uses 8,533 kWh a year in ResStock, and floor area takes gas-heated homes from 7,086 kWh at the small end to 10,682 kWh at the large end. The same mid-size home uses 33,800 kWh with a heat pump and 39,675 kWh with electric resistance heat.
Those electric-heat totals run well above real homes. Across Michigan, Ohio, Indiana, Illinois and Wisconsin, ResStock's single-family houses average 28,053 kWh a year with a heat pump and 36,790 kWh with resistance heat. The US Energy Information Administration's (EIA) 2020 Residential Energy Consumption Survey, which draws on utility bills, puts the same kinds of homes in those states at 20,694 and 19,861 kWh, and agrees on gas-heated ones (9,493 kWh against ResStock's 8,944). The survey year had 8% fewer heating degree days (a measure of how cold a year is) than normal for those homes, which explains little of the gap. Read the kWh for electric-heated homes as high. Their timing is not checked against real homes here, and every heating type in a state shares one heating pattern, so heat-pump timing in particular is approximate.
The simulated equipment explains some of the excess. HSPF, a heat pump's seasonal heating efficiency rating, is Btu of heat delivered per watt-hour of electricity. Of the 89 simulated Michigan houses with heat pumps behind the mid-size figure, 81 have air-source units rated 7.7 or 8.5 HSPF. The 89 houses average 23,079 kWh of heating electricity a year, only 20% below the resistance-heated home's 28,888 kWh, and 58% of it goes to the resistance backup, the electric heating elements that run when the heat pump can't keep up. ResStock's own cold-climate heat pump upgrade, rated 11 HSPF, cuts heating for the same houses to 12,610 kWh.
Florida homes need little heating, so floor area changes the total more than fuel does: 14,233 to 22,161 kWh across sizes for heat-pump homes, against 14,904 to 18,780 kWh across heating types.
Electric heat changes the winter day
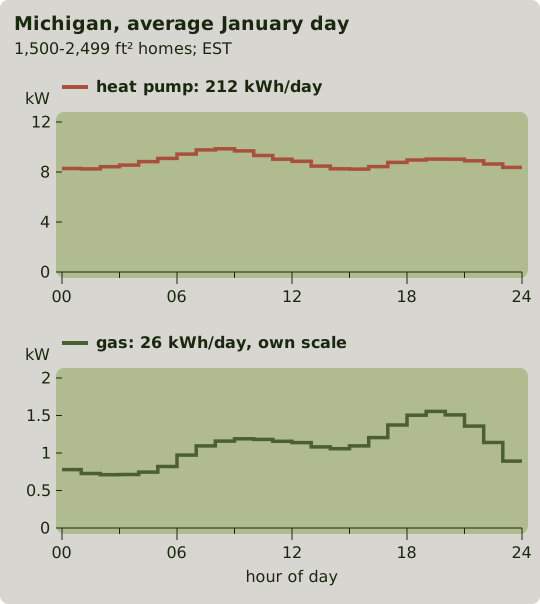
With electric heat the January load runs at 8 to 10 kW around the clock, so 59% of it falls in the roughly 14 hours of a Michigan January day with no sun. Fuel changes the balance between winter and summer more than size does: an average January day uses 0.87 times as much as an average July day in the mid-size gas-heated home, 5.6 times with a heat pump and 6.8 times with resistance heat. Size matters only for resistance-heated homes, taking that ratio from 5.8 in the smallest to 8.4 in the largest.
The season sets the peak hour
The most common home in each state has the state's most common size, cooling and heating: 1,500 to 2,499 ft² with air conditioning everywhere.
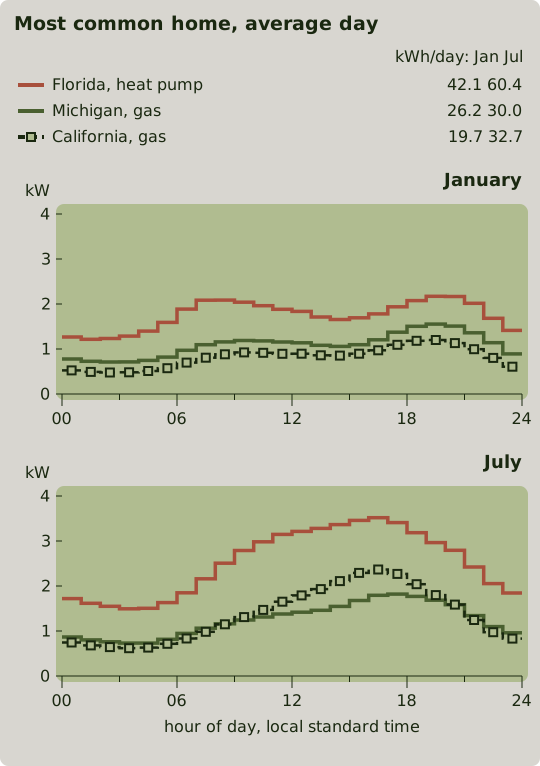
Use that is neither heating nor cooling (lighting, cooking, laundry, electronics) has its highest hour at 19:00 in 47 of the 49 areas, 18:00 in Maine and 20:00 in Arizona. In January the most common home peaks at 18:00 or 19:00 in 46 states and DC. North Carolina and South Carolina peak at 07:00: their most common homes have heat pumps in a colder climate than Florida's, heating is 63% to 68% of their January use against 26% in Florida's, and heating is highest at 07:00. In July every area peaks at 16:00 or 17:00, which is 5 pm or 6 pm on a daylight-saving clock.
Across the states
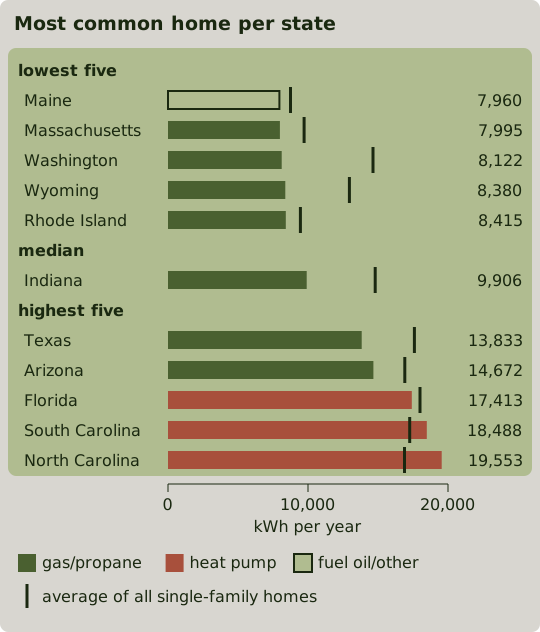
The three highest bars, the only areas where the most common home has a heat pump, are simulated heat-pump totals of the kind this article reads as high: the 2020 survey puts North Carolina's single-family heat-pump homes of 1,500 to 2,499 ft² near 14,500 kWh, against 19,553 here. ResStock's averages sit 5% to 31% above the survey's single-family averages in all 11 states shown.
The evening gap
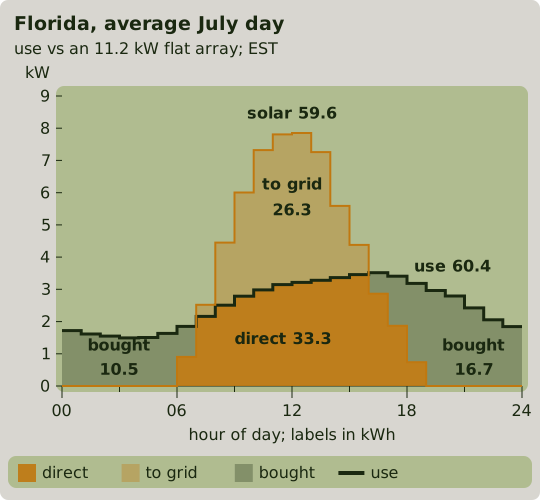
I paired the Florida home with a flat array sized to make exactly its yearly use of 17,413 kWh. Its output is the hourly horizontal irradiance (sunlight on a flat surface) in the typical year from NREL's National Solar Radiation Database at Middleburg, Florida, times 11.2 kW of panels, less a flat 14% system loss for wiring, inverter, dirt and heat. The production guide covers full estimates.
Direct use, which installers call self-consumption, is the share of the array's output used in the same hour it is produced: the year's hourly sum of the smaller of use and production, divided by total production. Because each array makes exactly the home's yearly use, it is also the share of the home's use that solar supplies directly. The same method for other homes gives:
| Home (weather for the array) | Annual use | Direct use | Use in hours with no sun |
|---|---|---|---|
| Florida, heat pump (Middleburg) | 17,413 kWh | 48% | 41% |
| California, gas (statewide load, Bay Area array) | 8,750 kWh | 49% | 40% |
| Arizona, gas (Gilbert) | 14,672 kWh | 50% | 39% |
| Michigan, gas (Kalamazoo area) | 8,533 kWh | 42% | 44% |
| Michigan, cold-climate heat pump (Kalamazoo area) | 23,331 kWh | 33% | 52% |
| Michigan, heat pump as simulated (Kalamazoo area) | 33,800 kWh | 30% | 54% |
The last row uses ResStock's 33,800 kWh, which the survey check puts well above real homes; the row above gives the same houses the cold-climate heat pump (heating 12,610 kWh), and the opening figures use it. Direct use rises only to 33% because use stays concentrated in winter, when a flat array makes least (see the first limit below).
Use in hours with no sun sets a ceiling on direct use, 48% to 61% for the first five homes. About half the year's hours have no sun at these sites, so a flat load would put 50% of its use there; the gas-heated homes put 39% to 44%, the Michigan heat-pump homes 52% to 54%. Midday and summer output beyond what the home is using at the time takes another 11 to 15 points, the most for the Michigan heat-pump home.
These shares come from a state-average load curve, smoother than any one household's, so they are optimistic: 40 individual simulated Florida heat-pump homes of the same size, each with its own array, have a median of 46.5% (middle 80%: 41% to 52%), and 40 gas-heated Michigan homes a median of 40%. Real households vary more, and mismatches within each hour lower the share further.
What the data leaves out
- The arrays are flat. A south-facing array tilted like a typical roof makes much more in winter than a flat one and about the same in summer, so direct use for the winter-heavy Michigan homes, the heat-pump homes most of all, would be higher than in the table.
- NREL's typical-year weather days do not line up with the solar database's typical year, so direct use is approximate.
- Only occupied single-family detached houses are included, with no electric vehicle charging, no Alaska or Hawaii, and one time zone per state.
How to check your own home
Many US utilities offer a year of hourly use as a "Green Button" download, and the building-load section of the Resi Solar tool accepts that file and shows it beside the modeled production for your roof. Two checks then compare your home with the simulated ones:
- The share of your use between 17:00 and 21:59 standard time (18:00 to 22:59 on the meter during daylight saving time). The most common homes range from 24% to 29%, the Michigan heat-pump and resistance-heated homes 21% to 22%, and a flat load 21%. Among the 40 Florida homes, each extra point of evening share cost about 0.9 points of direct use.
- Your average January day divided by your average July day. Simulated values run from 0.7 (Florida heat pump) and 0.8 to 0.9 (Michigan gas) to 3.4 with a cold-climate heat pump and up to 8.4 with the simulated electric heat. A higher ratio puts more use in winter, when an array makes least; in the table, direct use falls from 42% for the gas-heated Michigan home to 33% and 30% for the heat-pump homes.