Guide
Should you get a battery for your solar installation?
A home battery charged from solar saves money when a kWh used in the evening costs more than a kWh sent to the grid at midday earns. The gap has to be bigger than the 15% or so the battery loses moving the energy. I modeled 40 simulated Bay Area homes, each with a south-facing array sized to make its yearly use and a 13.5 kWh battery. Under net metering at a flat price, which credits each exported kWh at the full retail price, the grid already stored the surplus at no charge, and the battery lost $63 to $239 a year to round-trip losses. On PG&E's net billing plan, which pays about 1 to 7 cents for a midday kWh and charges 32 to 55 cents in the evening peak, the same battery saved a median of $823 a year.
PG&E's published schedule also has late-summer evening hours when it pays more for an export than it charges for a kWh. Set to send its stored energy to the grid in those hours, the battery saved a median of about $1,120, and about $1,200 with perfect knowledge of the year's weather and use. At the median quoted price of $1,074 per kWh, or $14,499 for 13.5 kWh, that is about 18 years to repay if the battery only covers the home's own use and 13 to 14 with the evening exports, against a 10-year Powerwall 3 warranty.
What a home battery does
A home battery is rated by the energy it can store and deliver, in kilowatt-hours (kWh), and by the power it can deliver at once, in kilowatts (kW). A Tesla Powerwall 3 stores 13.5 kWh and delivers up to 11.5 kW; an Enphase IQ Battery 5P stores 5 kWh and delivers 3.84 kW. The energy sets how much of the evening a battery can cover, and the power sets how many appliances it can run at the same time.
The battery's control software decides when it charges and discharges:
- Self-powered (self-consumption): charge from solar the home isn't using, discharge whenever the home uses more than the panels make, until empty. The battery section of the Resi Solar tool models this mode.
- Time-based: hold the charge for the hours when grid power costs the most, and on some rates send stored energy to the grid when exports are worth the most.
- Backup reserve: keep part of the charge for outages.
Without a battery, a grid-tied solar system stops during an outage. In the Department of Energy's words, solar systems "are designed to switch off if the grid power cuts out." With a battery and a switch that separates the house from the grid, some or all circuits keep running. The average US customer was without power for 11 hours in 2024, according to the EIA: nearly nine hours from major events such as storms, against an average of nearly four in 2014 to 2023, and about two from other causes, which changes little from year to year. That protection has value, but it doesn't show up on a bill, so the numbers below leave it out.
The homes and the model
The homes come from ResStock, the simulation of the US housing stock by NREL (now the National Laboratory of the Rockies). I drew 40 at random from the 3,908 occupied single-family homes without solar that it simulates in Santa Clara, Alameda, Contra Costa and San Mateo counties, where PG&E serves most homes. They use 2,704 to 19,896 kWh a year, with a median of 7,026. Each home gets an array facing south at a 20° tilt, sized to make its yearly use in a typical San Jose weather year from NREL's PVWatts.
Each home is billed on PG&E's E-ELEC time-of-use rate, which net billing customers must take, with its purchases and exports netted within each hour at one meter. The battery charges only from solar, runs in self-powered mode unless I say otherwise, and has the Powerwall 3's capacity and power.
Round-trip losses
Round-trip efficiency is the share of the energy put into a battery that comes back out. Datasheets give 89% for the Powerwall 3 (solar to battery to home), 90% for the IQ Battery 5P and a peak of 94.5% for the SolarEdge Home Battery. Measured in homes it is lower. The 2023 evaluation of California's Self-Generation Incentive Program, which covered 44,297 residential batteries, found 85% on average, counting the power the systems use to run themselves. I used 85% for every result in this article.
Figure 1 follows one of the homes through the average day of a year. It is a Contra Costa County house that uses 7,058 kWh a year, the middle of the 40, with a 4.3 kW array. The battery takes in 7.6 kWh of solar a day that the home isn't using and gives back 6.5 kWh. Over the year that is 2,788 kWh in, 2,370 kWh out and 418 kWh lost.
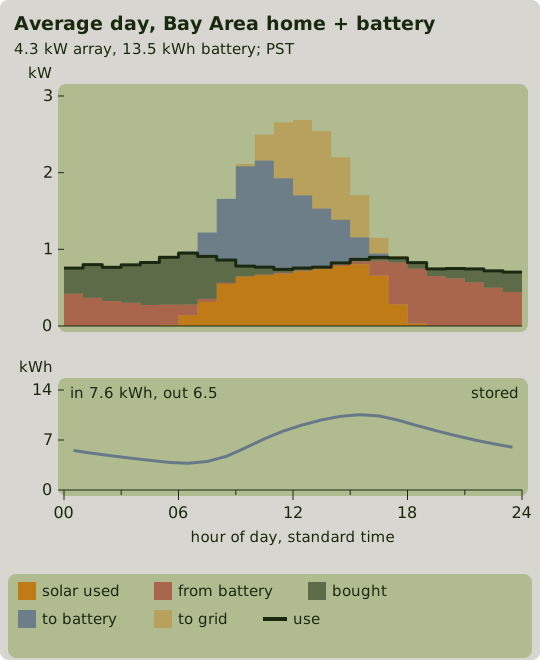
What the lost energy costs depends on what it would have earned. At the export values of the hours the battery charges, which average about 4 cents, the 418 kWh are worth about $16 a year. Under net metering at a flat 34-cent retail credit they would be worth $142, and a self-powered battery then loses about that much a year while saving nothing, because every kWh it returns could have been sent to the grid for full credit.
Prices change through the day
Most US households still pay one price per kWh all day. Time-of-use (TOU) rates, which charge more in a fixed evening window, are spreading, and PG&E requires one for new solar customers: its net billing tariff says residential customers "must take service on the E-ELEC" rate. Across the eight residential TOU rates I checked in California, Arizona, North Carolina and Colorado, the summer peak price ran 1.3 to 2.8 times the off-peak price, with peak windows of three to five hours between 16:00 and 21:00.
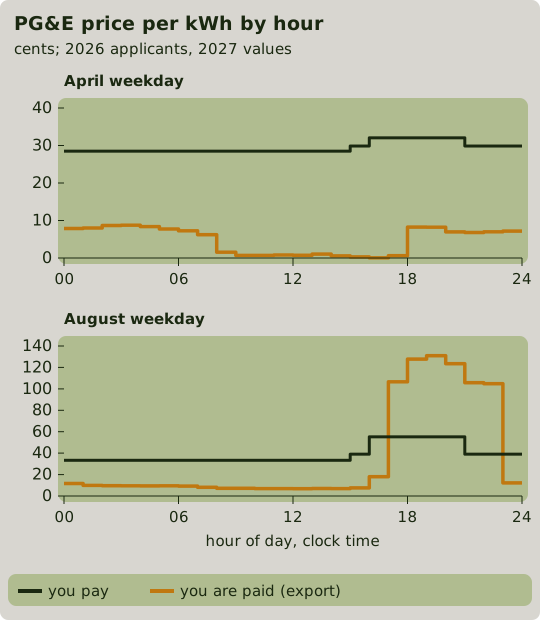
California's net billing tariff credits each exported kWh at a value set for every hour of every month from the state's Avoided Cost Calculator, a forecast of what that energy saves the grid. Customers keep the schedule of the year they apply for nine years from the day the system starts operating. The values in Figure 2 are PG&E's for systems applying in 2026, as scheduled for 2027. They fall to near zero in spring middays, when the state's solar output is high and demand is low, and rise in the evenings of late summer, when demand is high and solar output has gone. The August evening peak passes $1 per kWh only from 2026 to 2028; from 2029 the same schedule lowers it to 63 to 75 cents.
When the home uses its power
A battery can only store the solar a home doesn't use as it is made, so a household that runs its dishwasher, laundry and air conditioning at midday leaves less for it, and has less evening use for the battery to cover. The EIA describes US electricity demand as lowest around 5 a.m. and, in summer, highest around 5 or 6 p.m. In ResStock, a home of the most common size and heating type in most states uses the most at 18:00 or 19:00 in January (see when homes use electricity). Individual homes spread widely around that pattern: across the 40 homes, the share of the year's use between 10:00 and 16:00 on the clock ran from 19% to 41%, and the share of their solar used as it was made from 28% to 56%.
The homes also differ in size, which affects savings on its own. To isolate the timing, I moved part of each home's evening use, from 17:00 to midnight, into 10:00 to 16:00 and kept everything else the same, including the array. Figure 3 shows the result.
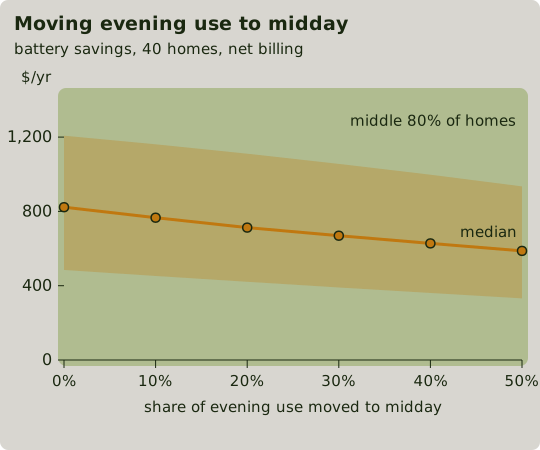
Moving half of each evening's use to midday also cuts the median bill without a battery by $294 a year, more than the $236 it takes off the battery's saving.
Savings under three export rules and an export setting
To isolate the export rule, I billed the same 40 homes, arrays and battery under three rules, and under net billing with a second battery setting (Figure 4):
- Net metering at a flat price: every kWh bought or exported is worth 34 cents, the average E-ELEC price for these homes.
- Net metering with TOU: exports are credited at the E-ELEC price of the hour they are made, roughly as under California's earlier net metering tariff.
- Net billing: E-ELEC prices for purchases and PG&E's hourly export values for exports.
- Net billing with evening export: self-powered mode, except that in every hour when PG&E's export value is above its price the battery stops charging and discharges at full power, to the home first and the rest to the grid.
Cases 1 to 3 use self-powered mode, and case 4 needs no forecast because those hours are fixed in PG&E's schedule. Under net billing, a year's export credits can offset purchases only down to the non-bypassable charges, surcharges of about 1.2 cents per kWh bought on E-ELEC that include public-purpose programs and the state wildfire fund. Credit beyond that carries forward but is never spent in a repeating year, so I counted only the credit each home can use.
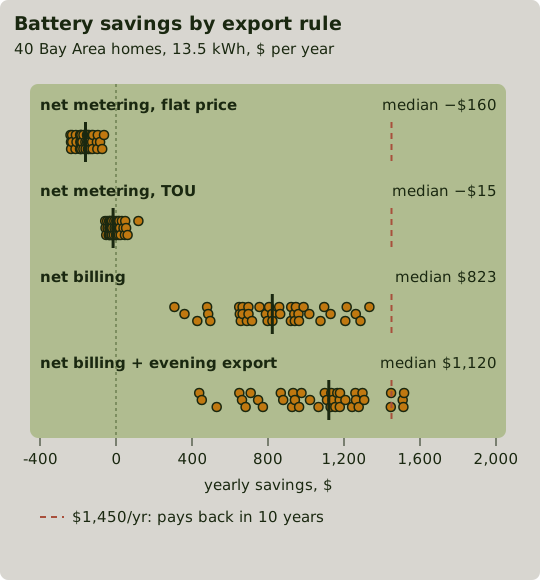
On the same net billing rate, a battery run by an optimizer that knows the whole year's sun and use in advance does only slightly better than self-powered mode when it isn't allowed to export: a median of $846 against $823. Most of the value comes from using solar at home that would otherwise be exported for a few cents, which self-powered mode already does. Exporting adds more, because PG&E's export values on late-summer evenings exceed its prices. Those hours are set in advance: in 2027 there are 246 of them, all on August and September evenings, the only months when the export value rises above the price. The evening-export setting of Figure 4 saves a median of $1,120, and the same optimizer, allowed to export at any hour, reaches $1,193 ($437 to $1,655), so the schedule captures most of what timing can add. In that best case, 22 of the 40 homes earn more export credit than they can spend. On net metering with TOU, the optimizer gets a median of $70 a year where self-powered mode loses $15.
The same arithmetic applies elsewhere: each kWh moved from midday to evening is worth the evening price minus 1.18 times the midday export credit, since 1.18 kWh must go in for 1 kWh to come out.
| Where | Evening price (¢/kWh) | Midday export credit (¢/kWh) | Value of a kWh moved (¢) |
|---|---|---|---|
| PG&E, E-ELEC and net billing, August peak | 55.2 | 6.9 | 47.1 |
| PG&E, E-ELEC and net billing, April peak | 32.1 | 0.8 | 31.2 |
| APS, Arizona, TOU-E, summer weekday 4–7 pm | 34.4 | 5.6 | 27.9 |
| Hawaiian Electric, Oahu, Smart DER | 40.6 | 13.5 | 24.7 |
| Texas, 3-cent retailer buyback | 15.5 | 3.0 | 11.9 |
| DTE, Michigan, average price and outflow credit | 20.0 | 8.7 | 9.8 |
| Idaho Power, October to May | 11.8 | 2.9 | 8.4 |
| Rocky Mountain Power, Utah, June to September | 13.1 | 4.9 | 7.4 |
| National Grid, Massachusetts, net metering | 40.1 | 33.7 | 0.5 |
| Full retail net metering at 15 cents | 15.2 | 15.2 | −2.7 |
The APS price is the base tariff price before riders, and the Massachusetts row uses National Grid's R-1 per-kWh price. The Hawaii, Texas, Michigan, Idaho, Utah and 15-cent rows use the EIA's 2025 state average prices, which include fixed monthly charges and so overstate the per-kWh price a little; DTE's standard rate is time-of-day.
These values assume every kWh the battery returns replaces one bought at the evening price. A self-powered battery also discharges after the peak window closes: across the homes a median of 45% of the battery's output fell in PG&E's 16:00 to 21:00 peak (28% to 67%), and the batteries earned 28 to 34 cents per kWh moved (median 31), close to the April row all year. The batteries moved a median of 2,668 kWh a year. A battery that moved as much in Texas, Michigan, Idaho or Utah, at 7 to 12 cents per kWh moved, would save about $200 to $320 a year.
Sizing the battery to the house
A battery earns money only on the energy it cycles, and on most days that is capped by the smaller of two things: the solar surplus that day, and the evening and overnight use that follows. For the home in Figure 1, the median day offers 6.6 kWh that can be moved; one day in ten offers 3.1 kWh or less, and one in ten 11.2 kWh or more. A 13.5 kWh battery has capacity to spare on 98% of days. It still fills on most days from April to October because it rarely empties overnight: on the middle half of those days 3.5 to 8.2 kWh is still stored at dawn, and about 6 kWh cycles each day.
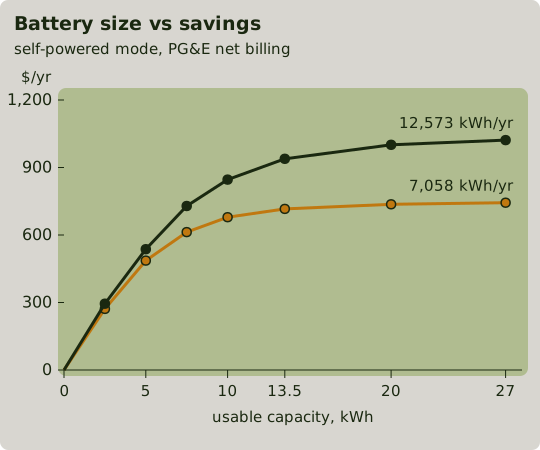
Figure 5 runs the Figure 1 home and a larger one with batteries from 2.5 to 27 kWh. Going from 5 to 13.5 kWh adds $230 a year for the 7,058 kWh home, and doubling to 27 kWh adds another $28. The larger home, with a 7.7 kW array and more evening use, gains $92 from 10 to 13.5 kWh and $62 more at 20 kWh.
Charge power also matters: it limits how fast a battery can absorb a large array's midday surplus, and discharge power limits how much of the evening load it can carry at once; when use runs above that, the grid supplies the rest.
What it costs and how long it takes to pay back
EnergySage's marketplace quotes put storage at a median of $1,074 per kWh in the second half of 2025, or $14,499 for 13.5 kWh, the median battery size Lawrence Berkeley National Laboratory found paired with home solar in 2024. The federal Residential Clean Energy Credit, which covered batteries bought by homeowners, is "not available for any property placed in service after December 31, 2025," according to the IRS. Batteries owned by a leasing company can still earn the business investment credit under Section 48E, which for storage runs through 2033 before phasing down, subject to rules on components from certain foreign suppliers.
At that price, the median net billing saving of $823 repays a 13.5 kWh battery in 17.6 years, the evening-export $1,120 in 12.9 years and the best-case $1,193 in 12.2 years. EnergySage's price for a Powerwall 3 includes its built-in solar inverter, so in a new solar installation the battery adds somewhat less than $14,499. The Powerwall 3's warranty runs 10 years and promises 70% of its capacity at the end; the IQ Battery 5P's runs 15 years or 6,000 cycles and promises 60%. For the smaller home, a 5 kWh battery at the same price per kWh, $5,370, saves $486 a year and repays in 11 years. Small systems often cost more per kWh than large ones, because installation and wiring costs don't shrink with capacity, so that figure is optimistic. All of these paybacks hold 2026 prices and 2027 export values flat for the life of the battery and ignore the loss of capacity as it ages. The 2027 export values favor the evening exports: averaged over the nine years of PG&E's 2026 schedule, 2026 to 2034, the evening-export setting saves a median of $1,038 a year and repays in about 14 years. The self-powered saving changes by less than $15 from year to year. PG&E's export schedule for a 2026 system runs nine years, which ends before a 17.6-year payback does; the values after it are not set. The companion article on whether solar is a good investment finds $1,079 a year for a statewide profile of California's most common simulated home, which uses 8,750 kWh, more than the median home here.
When a battery pays
The savings come from the gap between the evening price and the midday export credit, applied to solar the home would otherwise export and can use the same evening. On PG&E net billing the price gap is large, and most of a home's midday surplus can be used the same evening. For the median of the 40 homes, a 13.5 kWh battery repays itself in about 18 years in self-powered mode, beyond both the Powerwall 3's 10-year warranty and the IQ Battery 5P's 15, and in 13 to 14 years if it is also set to export in the late-summer evening hours when PG&E's export value is above its price, inside the IQ Battery 5P's 15-year warranty but not the Powerwall 3's. A household that uses more of its power in the evening repays sooner (Figure 3), and so does a smaller battery sized to the home's evening use. On full retail net metering the gap is zero, and a battery is bought for backup power. Where a utility pays a few cents for exports and charges a flat 12 to 20 cents, a battery keeps midday solar from being sold for a few cents, but at $200 to $320 a year it doesn't repay a $14,000 battery within its warranty.
What the model leaves out
- The homes are simulated, not metered, and the solar output is one typical weather year. The weather days in the two data sets don't line up, which matters more for single days than for yearly totals.
- I netted purchases and exports within each hour. PG&E records them separately ("no netting of imports (consumption) and exports"), so a home without a battery exports and buys more within each hour than this model shows, and a self-powered battery's real savings are probably a little higher.
- Demand charges, a monthly charge on the home's highest hourly use that some utilities add for solar customers, and payments for letting the utility draw on the battery during grid emergencies are left out; both can make a battery pay where this model says it doesn't. So is charging the battery from the grid.
- Loss of capacity with age, electric vehicles, PG&E's monthly base services charge (which a battery doesn't change), rebates such as California's Self-Generation Incentive Program, and the ACC Plus adder, an extra export credit of under 1 cent per kWh for early net billing customers, are left out.
- Many homes in these counties buy their generation from a community choice aggregator, a local public agency that buys power in place of PG&E. Its generation prices and export credits differ from PG&E's.
How to check your own home
- Download a year of hourly use from your utility (the "Green Button" file many utilities offer) and look up your export credit by hour in your tariff. If you don't have solar yet, estimate your hourly production with PVWatts or the Resi Solar tool; your midday surplus is production minus use.
- Work out the value of a kWh moved: the average price you pay in the hours the battery will discharge (late afternoon through the night for a self-powered battery, not only the peak window), minus 1.18 times your midday export credit. If it is near zero or negative, a battery won't lower your bill.
- Estimate how much the battery can move on a typical day: the smallest of 85% of your midday surplus, your use from late afternoon to the next morning, and the battery's usable capacity. Multiply by 365 and by the value per kWh for a rough yearly saving.
- On a net billing rate, find the hours when your export credit is higher than your price; a battery set to export in those hours earns the difference on each kWh it holds.
- Divide the installed price by the yearly saving and compare the result with the warranty term.
The battery section of the Resi Solar tool runs the hourly version of step 3 against modeled production for your roof and your uploaded use.