Guide
Is solar a good investment? What it costs and what the power is worth
At the Solar Energy Industries Association's (SEIA) latest national average of $3.36 per watt of panel capacity, the median 7.2-kilowatt (kW) home solar system costs about $24,200, and a homeowner who buys one now gets no federal tax credit. A kW of panels is what they put out in full sun; a kilowatt-hour (kWh), the unit on an electric bill, is a kW for an hour. What the system earns back depends on what a kWh from the panels is worth to the household: the retail price for power the home uses as it is made, and the utility's export credit for the rest. For ten states, with an array sized to a typical home's yearly use, the system would pay for itself in 9 years in Massachusetts and in 22 in Texas, a yearly return on the price of 11% down to 1%.
What a system costs
SEIA and the research firm Wood Mackenzie publish a modeled national average price for residential systems each quarter. The Q3 2026 report puts it at $3.36 per watt for the second quarter of 2026, and the public summaries since early 2025 give $3.35 to $3.39. Lawrence Berkeley National Laboratory (LBNL) found a median home system size of 7.2 kW in 2024, so the typical system costs $24,192 at SEIA's price.
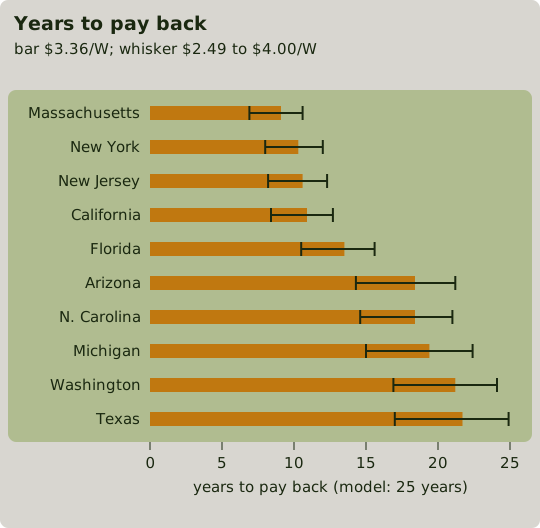
Other sources measure different things. LBNL's median of prices reported for systems the homeowner owns was $4.00 per watt in 2024, with the middle 60% of systems between $3.00 and $5.20, and loan-financed systems were priced well above cash sales, at medians of $4.70 and $3.50 per watt. EnergySage's median quote on its marketplace was $2.49 per watt in the second half of 2025. For a 7.2 kW system, $2.49 to $4.00 per watt is $17,928 to $28,800, and Figure 2 shows payback at both ends.
The federal Residential Clean Energy Credit paid 30% of the cost of a home system until the end of 2025. The IRS now says it "is not available for any property placed in service after December 31, 2025," and an installation completed after that date doesn't qualify even if it was paid for earlier. A lease or power purchase agreement, in which a company owns the panels on your roof and rents you the system or sells you its power, can still use the business credit under Section 48E, which the company claims. For solar that credit ends for systems placed in service after 2027, unless construction began by July 4, 2026.
SEIA's public summaries don't give a price for home batteries. EnergySage's median quote was $1,074 per kWh of storage in the second half of 2025, which puts a 13.5 kWh battery, the median size LBNL found paired with home solar, at $14,499. In LBNL's 2024 data, most of it from California, systems with a battery sold for $1.70 per watt of panels more than systems without one, or $12,240 on a 7.2 kW system. Solar with a battery therefore costs about $36,000 to $39,000 at SEIA's solar price.
What the power is worth
An electric bill has two kinds of charges. Fixed charges, such as a monthly customer charge, a minimum bill or PG&E's new base services charge, stay the same whatever the panels make. Per-kWh charges for energy and delivery are what solar reduces. Each kWh from the panels reaches the bill in one of two ways:
- Used as it is made. It replaces a kWh the home would have bought, so it is worth the full per-kWh price. With an array sized to make a year's use, the state profiles in this article used 39% to 48% of their solar this way (see when homes use electricity for why the share stays under half).
- Exported. The rest goes to the grid and earns the utility's credit for exports. Under net metering, an exported kWh offsets a kWh bought later at the retail price, or close to it. Under net billing and other export-credit plans, it earns a set rate that is usually a small fraction of the retail price.
For each state I used the export rule a new residential customer gets in 2026 from one large utility, or the state's rule where it sets one. The city supplies the weather for the solar output:
| State (weather) | Retail price | Export credit | Rule |
|---|---|---|---|
| Massachusetts (Boston) | 30.5¢ | 25.6¢ | Net metering at about 84% of the retail price (National Grid) |
| New York (Albany) | 26.4¢ | 26.4¢ | Net metering, plus a monthly charge of $0.97 per kW of panels (National Grid) |
| New Jersey (Trenton) | 22.6¢ | 22.6¢ | Net metering, credits carried for a year |
| California (San Jose) | 34.9¢ | 3.6¢ | Net billing: hourly export values (PG&E, E-ELEC rate) |
| Florida (Orlando) | 15.2¢ | 15.2¢ | Net metering, credits carried for a year |
| North Carolina (Charlotte) | 14.0¢ | 11.4¢ | Net metering month by month, each month's excess at 4.53¢, plus $0.99 per kW of panels a month (Duke Energy) |
| Michigan (Detroit) | 20.0¢ | 9.3¢ | Outflow credit (DTE's credit per exported kWh), 8.7¢ to 14.4¢ by hour |
| Washington (Seattle) | 13.1¢ | 13.1¢ | Net metering, unused credits lost each March 31 |
| Texas (Houston) | 15.5¢ | 7.0¢ | No net metering; a retailer's 7¢ buyback plan |
| Arizona (Phoenix) | 15.3¢ | 5.6¢ | Export rate locked for 10 years (APS) |
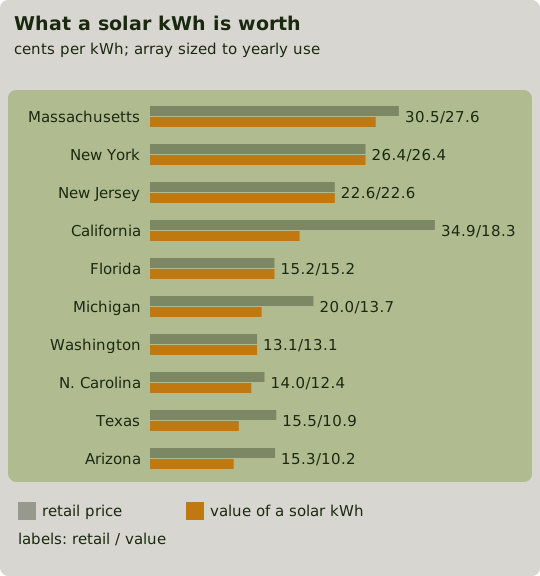
Retail prices are the 2025 state averages from the US Energy Information Administration (EIA), except California, where I used PG&E's E-ELEC time-of-use rate, which charges more per kWh from 4 to 9 p.m. and which net billing customers must take, weighted by the home's use. The export credit is the average over the kWh this array exports. Figure 1 combines the two into what an average kWh from the array is worth.
Payback by state
For each state I used ResStock, the simulation of the US housing stock by NREL (now the National Laboratory of the Rockies): the hourly pattern of all the state's simulated single-family homes, scaled to the yearly use of the most common type of home there. I paired it with an array facing south at a 20° tilt, sized to make that yearly use, with hourly output from PVWatts, NREL's solar output calculator, for the city in the table. The system costs $3.36 per watt, with no incentives. Each year:
- output falls 0.5%, the median degradation rate in NREL's review of field studies;
- retail prices rise 3.2%, the average yearly rise in the US residential price from 2015 to 2025 (12.65 to 17.30 cents), while fixed export credits stay flat;
- operation and maintenance (O&M), including a reserve for replacing parts such as the inverter, costs $30.36 per kW of panels, NREL's 2023 benchmark.
A pattern averaged over thousands of homes is smoother than one home's, so it uses more of the solar as it is made. Across 40 individual Bay Area homes in the battery article, the share ran from 28% to 56%, with a median of 41%, against 47% for California's profile here. Where exports earn less than retail, a single home's payback is likely somewhat longer than the results below.
The results use three measures:
- Payback is the number of years until the savings add up to the price. It ignores what happens afterward.
- 25-year gain is the savings over 25 years less the price and the upkeep, in dollars of each year, not discounted.
- Return is the internal rate of return, before inflation: the interest rate an account would have to pay to turn the price into the same 25 years of savings. It lets you compare the system with other uses of the money.
Figure 2 gives the payback at SEIA's price and at the low and high prices above.
| State | Array | Price | Year-1 savings, net of upkeep and solar charges | Payback | 25-year gain | Return |
|---|---|---|---|---|---|---|
| Massachusetts | 6.1 kW | $20,634 | $2,024 | 9.1 years | $51,825 | 11.3% |
| New York | 7.1 kW | $23,942 | $2,005 | 10.3 years | $48,963 | 9.6% |
| New Jersey | 7.0 kW | $23,568 | $1,920 | 10.6 years | $45,527 | 9.2% |
| California | 5.3 kW | $17,937 | $1,441 | 10.9 years | $32,050 | 8.8% |
| Florida | 11.3 kW | $37,884 | $2,311 | 13.5 years | $46,156 | 6.4% |
| Arizona | 8.4 kW | $28,087 | $1,250 | 18.4 years | $13,228 | 2.9% |
| North Carolina | 13.5 kW | $45,419 | $1,856 | 18.4 years | $23,272 | 3.0% |
| Michigan | 6.6 kW | $22,216 | $965 | 19.4 years | $8,150 | 2.4% |
| Washington | 7.5 kW | $25,087 | $838 | 21.2 years | $6,403 | 1.6% |
| Texas | 9.7 kW | $32,699 | $1,208 | 21.7 years | $6,404 | 1.3% |
The array sizes differ because the homes do. ResStock's most common Florida and North Carolina homes are heat-pump homes using 17,400 and 19,600 kWh a year, Arizona's and Texas's gas-heated homes use 14,700 and 13,800 kWh, about half of it for cooling, and the rest use about 8,000 to 9,400 kWh. Where exports earn the full retail price, payback doesn't depend on array size, since the price and the savings both scale with it. Where they earn less, size matters, as a later section shows. Sunshine matters as well: a kW of panels makes 1,088 kWh a year in Seattle and 1,755 in Phoenix.
Year by year
Figure 3 follows the money year by year in three of the states, per kW of panels so that different system sizes compare directly, with retail prices rising and held flat.
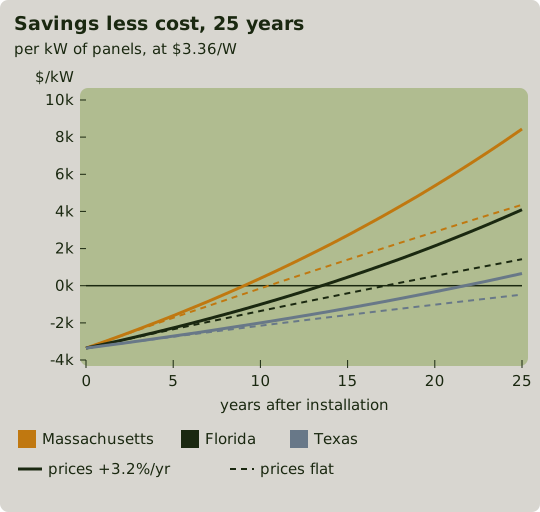
The rise in retail prices carries much of the result. The US average went up 0.8% a year from 2015 to 2020 and 5.6% a year from 2020 to 2025, and the first seven months of 2026 ran 7% above the same months of 2025. With prices held flat, payback lengthens from 9.1 to 10.5 years in Massachusetts and from 13.5 to 17.2 years in Florida, the return falls to 8.0% and 3.0%, and the Texas, Washington and North Carolina systems don't pay back in 25 years.
A loan adds interest, and LBNL found that loan-financed systems were also priced higher to begin with: a median of $4.70 per watt in 2024, above the top of Figure 2's whiskers. At $4.70, before any interest, payback would be 12.1 years in Massachusetts and 17.7 in Florida, and the Texas, Michigan and Washington systems wouldn't pay back in 25 years. With a lease or power purchase agreement there is no purchase price: the saving is the drop in the bill less the monthly payment, and the leasing company keeps the tax credit.
Where exports earn little, a smaller array pays back sooner
When exports earn a fraction of the retail price, the first kW of panels, whose output the home mostly uses as it is made, is worth more than the last. Halving each array (sizing it to half the home's yearly use) shortened payback from 10.9 to 7.4 years in California, 18.4 to 14.2 in Arizona, 19.4 to 15.4 in Michigan, 21.7 to 17.2 in Texas and 18.4 to 16.2 in North Carolina. In Massachusetts, where exports earn 84% of the retail price, it shortened from 9.1 to 8.6 years, and in New York, New Jersey, Florida and Washington, where they earn the full price, it didn't change.
The smaller array saves less each year but costs half as much. Over 25 years it gained more than the full array in Arizona ($14,765 against $13,228), Michigan ($9,447 against $8,150) and Texas ($10,164 against $6,404), and less in California and North Carolina. Its return was higher in all five, 14.1% against 8.8% in California. Small systems often cost more per watt, since some installation costs are fixed, which narrows the gap.
Adding a battery
A battery moves solar from midday into the evening. That is worth money only when the evening kWh costs more than the midday export earns, by more than about 18%, since 1.18 kWh must go in for each kWh that comes out at the 85% round-trip efficiency measured across California home batteries. With a 13.5 kWh battery charging from each home's surplus and discharging to its evening use:
- California's profile saved $1,079 a year, which repays a $14,499 battery in 13.4 years. Individual homes save less: the 40 Bay Area homes in the battery article saved a median of $823 on the same rate, 17.6 years to repay, because a single home's evening use doesn't absorb the battery's charge as evenly as a statewide profile does. The Powerwall 3's warranty runs 10 years.
- Arizona, Michigan and Texas saved $265 to $356 a year, which would take 41 to 55 years to repay the battery at the state average prices used here.
- In the states that credit exports at or near the retail price (Massachusetts, New York, New Jersey, Florida, Washington and North Carolina with its monthly netting), the battery saved $12 a year in Massachusetts and lost $60 to $142 a year elsewhere, because every kWh it stored could have earned full credit on the grid.
What the numbers leave out
- State incentives. Added to the model, New Jersey's Administratively Determined Incentive, 7.7 cents per kWh of solar output for 15 years for residential systems registered from July 27, 2026, is worth about $726 in the first year and shortens payback from 10.6 to 8.3 years. Massachusetts' SMART 3.0 base incentive of 3 cents per kWh in 2026 is worth about $240 a year and shortens payback from 9.1 to 8.3 years. Local rebates vary too widely to include.
- Retail prices and fixed charges. The EIA averages are total residential revenue divided by kWh sold, across every utility in the state. They include fixed monthly charges, which solar doesn't reduce, and a given utility's per-kWh price can sit well above or below them: National Grid's per-kWh price in Massachusetts is 40.1 cents against the state's 30.5, and at that price the Massachusetts system pays back in 7.0 years instead of 9.1. Minimum bills cap savings the other way. The model lets the Florida home's bill fall to nearly zero; at FPL's $30 minimum base bill every month it would save up to $360 a year less, and payback would lengthen from 13.5 to about 15 years.
- Time-of-use rates. Duke Energy in North Carolina requires solar customers to take a time-of-use rate, DTE's standard rate in Michigan charges more from 3 to 7 p.m. on weekdays, and APS in Arizona offers time-of-use plans such as TOU-E; I used the state's average price in all three. On those rates a battery is worth more than the flat price shows: the battery article puts a kWh moved into APS's summer weekday peak at about 28 cents.
- Policy changes. California locks a customer's export values for nine years and APS for ten; other export rules can change during the life of a system. Washington's net metering law requires it until mid-2029 or until a utility reaches its cap; Puget Sound Energy has passed its cap and keeps offering it until it adopts a successor tariff.
- The roof. Every array here faces due south at 20° with no shade. East- or west-facing roofs make less (see west-facing solar panels), and a roof that needs replacing during the system's life adds the cost of removing and refitting the panels.
- The model. The homes are simulated and the weather is one typical year. Purchases and exports are netted within each hour; utilities that meter them separately, as PG&E does, count a little more export and purchase than this.
How to check your own quote
- Divide the quoted price by the system size in watts. SEIA's average is $3.36; the sources above run from $2.49 to $4.00, and LBNL's middle 60% of 2024 systems from $3.00 to $5.20.
- Find your per-kWh price on your bill: the energy and delivery charges per kWh, not the fixed monthly charges.
- Look up your utility's credit for exported kWh in its net metering or export tariff.
- Estimate a year's savings as the system's yearly output times the value of a kWh: roughly 45% of the output at your per-kWh price plus 55% at the export credit, for an array sized to your yearly use.
- Subtract about $30 per kW a year for upkeep from that saving and divide the price by the result. This holds power prices flat, so it comes out longer than Figure 2, which assumes they rise 3.2% a year: for the homes here it gives 10.2 years in Massachusetts against Figure 2's 9.1, and 27 in Texas against 21.7.
The Resi Solar tool estimates hourly output for your own roof, and its building-load section compares it with a year of hourly use you upload from your utility, or a modeled one.